Watch List for the week of March 31, 2014
In addition to software design and development, I also trade stocks. To improve my own skills, I’m going to start dropping a list of stocks I’m watching and why I’m watching them here each week. While I’ll try to note any fundamental reasons I’m mentioning them, most of my trading is based of technical analysis of the underlying security. The discussion on this blog will focus on that.
I primarily focus on OTC penny stocks. There was a lot of action in this space last week, especially near the end of the week with a huge selloff on some of the marijuana related tickers. Many of the charts are in some sketchy territory as they rebound and attempt to resume their upward trends. Here’s some of what I’m looking for this week.
As a disclaimer, I don’t currently have any position in any of the tickers listed, but it’s safe to assume that I may initiate a long position in any of them at some point this week.
SPLI
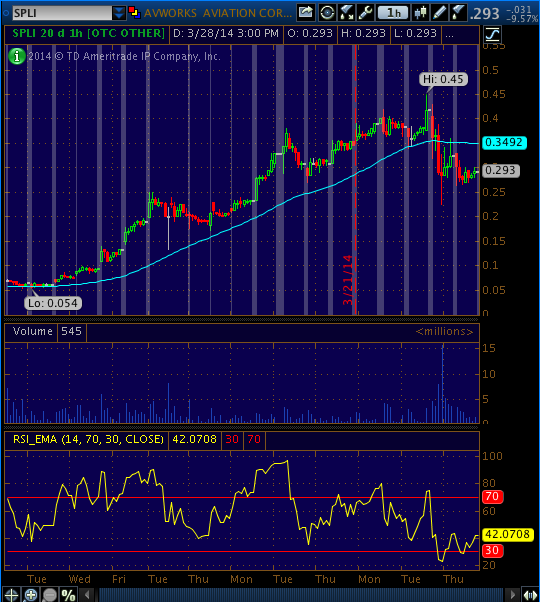
By all accounts, SPLI got hit hardest of all on Thursday. The CANN halting sent shockwaves through the sector. SPLI itself, while still very bullish, had a couple of days of slightly weaker growth, setting it up for a short opportunity for bears.
SPLI had been maintaining a very strong uptrend, with typical retracement of about 38.2% during each pullback. On Thursday, it was way oversold and retraced nearly 62% from the start of it’s huge bull run. As seen in the chart, once it fell through it’s 50 day simple moving average, it fell all the way to around 0.23, a level not tested since it served as resistance on March 17th.
Trading on Friday confined itself to a channel from about 0.264 to 0.302. The RSI has cooled off quite a bit and it sitting right around 42. If we can get through the current resistance of 0.302, we’d ideally want to see the chart get back above the current SMA of 0.34 to feel comfortable about the new uptrend. Expect a couple more resistance points at 0.36 and 0.38, and obviously our blue-sky point is at 0.45.
SPLI is definitely a darling on Twitter, and with recently reported revenues approaching $2 million for last year, I’d don’t expect it to be too much of a problem for the stock to continue it’s uptrend. But I’m going to watch it for a minute first.
LVGI
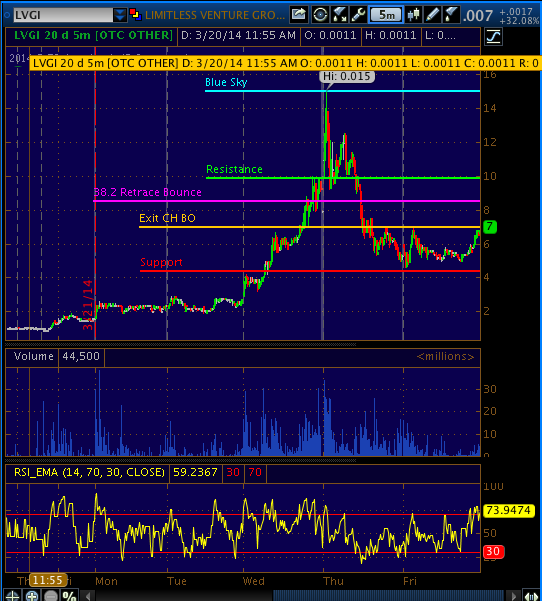
LVGI had a monster week. I wasn’t in on this stock at any point, but it definitely looks like it might have the legs for another run, so I might get in for a small position early this week. I’m going to show a shorter term chart on this one because there’s some interesting action on that chart. Additionally, prior to last week, this ticker was doing absolutely nothing.
First, it’s important to note that any kind of technical analysis on this stock is kind of sketchy because we don’t have much history to go off of. We’ve really only have the last week of price action to make any kind of decisions off of. This stock made huge moves on Wednesday before falling like everything else on Thursday. In it’s fall, it dropped a similar 62% like other tickers. For me, that would indicate that the current uptrend from the low base up to 0.015 had been broken. That doesn’t mean it won’t return to an uptrend. That just means I’m going to be looking for verification of another uptrend.
There are definitely hints of it being there. The closing price of 0.007 just so happens to be a resistance point we touched two other times in the last couple of days. There’s also the indication that a cup-and-handle is forming there (we just need that handle). If that occurs, we’ll see a slight pullback before blowing through that 0.007 resistance.
Depending on the opening Monday, we could very well gap right through it anyway. At that point, you’d want to watch out for that purple line I’ve put in there labeled “38.2 Retrace Bounce”. That line, at 0.0085, is a reasonable place that this chart could bounce back from and continue a bearish trend as more sales continue (it’s the 38.2% Fibonacci Retracement line for the short term downtrend). It also represents a previous level of resistance before our previous blue sky breakout. If we can get through that, a few of our other resistance points might turn back into support for us as we continue the new uptrend.
Be wary of a few things. There isn’t much support below where we’re at now, so if we break that line I’ve got in there at 0.0043, it’s could bottom back out. Additionally, this play looks like it’s just gaining popularity for the chart potential itself, as the company hasn’t released any official news since mid-February. We’re currently above the 50 SMA of 0.00559, and we’ll want to keep it that way to confirm the bull trend. RSI isn’t too hot at 73, so there’s still some room to run. Just watch for those couple of places of support (the red line and the SMA), and watch for breakouts. Take profits when you can.
REDG
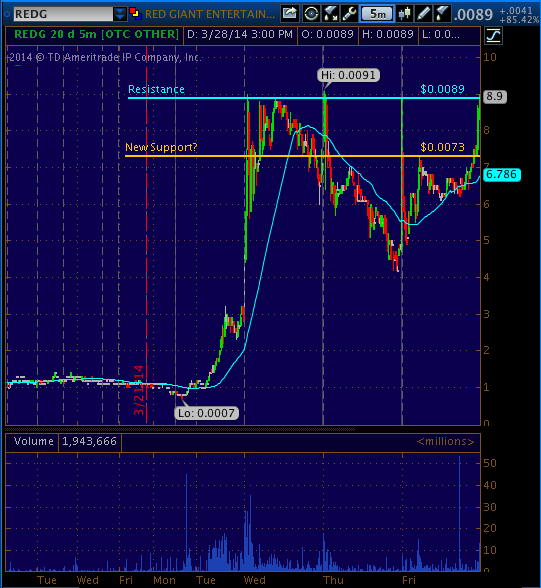
Here’s another ticker that had been dead before last week. REDG absolutely exploded from the triple-zero ranks (0.0007) and nearly hit penny-land many, many times over the last half of the week. There are some fundamentals in play. The company, Red Giant, had a few pieces of good news regarding upcoming products. The jump, however, occurred because a few traders on Twitter and IHub found this potentially undervalued stock and brought it to the masses.
That’s not a bad thing. The company is a real company. They have a product and a business that can be valued. This can bring in traders who focus on fundamentals, and the more traders in a ticker the better. We’re going to have to look at another pretty short-term chart, because prior to last Tuesday, this ticker had been steadily falling since mid 2013.
This ticker has been testing 0.01 (really, 0.091) very hard. There are a LOT of old shareholders sitting around that bought in higher (per ihub). This newfound interest and volume on their ticker has got them pumped. This 0.01 mark is going to be a pretty hard resistance point, as it served for resistance over much of last fall. Ideally, our new support will be that previous resistance line of 0.0073. We’ve got a slight cup and handle forming, so if we don’t gap through the resistance, you could expect a slight pull back as some people take profit (or try to break even) before we rebound and head into pennyland. But you’ll want to keep a close eye on it here. Verify that we’ve got the motion we need before getting to far in.
Once we’re safely through 0.01, it’s reasonable to expect to hit our next resistance pretty quickly around 0.011-0.013. There was a lot of consistent resistance here back in December and September. RSI is pretty warm at 84, so don’t be surprised for a little cooling off in the next dar or so. Finally, we’re well above our SMA of 0.0067, but that’s probably not going to be that useful for a while until we get some solid trends in.
Others
In addition to the tickers above, there are more tickers I’m watching that either have similar charts to those above or have patterns that I’m just not sure if I’m going to make an early move on or not. I’ll list them out here, and you can look into them on your own.
BAYP
MINE
TTDZ
ERBB
MYEC
LATF
USEI
UTRM
STEV


